Video Games sales in U.S. March 2016
Combined sales across hardware, physical software, and accessories in March 2016 were flat to last March as growth in physical software and accessories offset the 19 percent decline in hardware sales.
NPD Group's U.S. Games Industry Sales (New Physical Sales Channel*) - March 2016
5-week month; Reporting Period 02/28/16 through 04/02/16
| Dollar Sales | Mar'15 | Mar'16 | CHG |
|---|---|---|---|
| Total Video Game Sales (New Physical Channel) | $968.4M | $964.1M | 0% |
| Video Games Hardware | $311.1M | $253.2M | -19% |
| Video Games Software (Console+Portable - New Physical Sales only) | $395.4M | $425.8M | 8% |
| Video Games Accessories | $261.8M | $285.1M | 9% |
| Total Software Sales - (Console+Portable+PC - New Physical Sales Only) | $404.9M | $433.0M | 7% |
Hardware
Video game hardware dollar sales declined by 19 percent in March 2016, with unit sales dropping 17 percent. The difference in trends was due to some softening of average retail prices of 2 percent versus last March.
Portable hardware sales had the highest dollar sales volume decline versus last March, followed closely by eighth generation consoles. Seventh generation consoles had a steep percentage decline of 78 percent, though those sales now represent only 2 percent of the month's sales.
Software
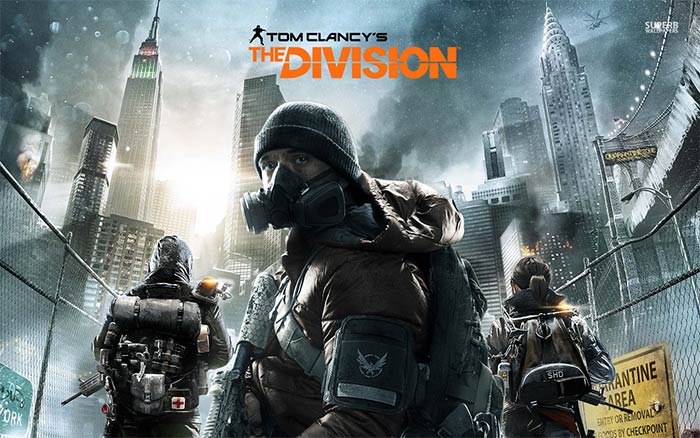
 Sales of new launches, driven by Ubisoft's "Tom Clancy's The Division" helped propel March 2016 video game physical software sales 8 percent higher than last March. Overall sales of new launch titles grew by 26 percent, with those launched in Q1'16 (Jan-Mar) collectively selling 28 percent higher in March than Q1'15 launches performed during the same time period last year. This speaks to the strength of this year's launch slate so far.
"Tom Clancy's The Division" had the best launch month for any Tom Clancy title to-date, having sold 40 percent more than the next best-selling Tom Clancy title, March 2008's "Tom Clancy's Rainbow Six: Vegas 2" (when adjusted for number of days sold within the month).
Stemming from strong launches of "Tom Clancy's The Division" and "Far Cry: Primal" Ubisoft is the number one software publisher for Q1 2016, with a unit sales increase of close to 130 percent, and a dollar sales increase of over 200 percent.
Software unit sales for eight generation consoles increased 36 percent, offsetting the seventh generation decline of 55 percent. This resulted in overall console software unit sales increasing 4 percent, with revenue up 10 percent compared to last March. For Portable software, unit sales and revenue were down 19 percent and 16 percent, respectively, in March 2016 compared to last year.
| March 2016 Top 10 Games (New Physical Retail only; across all platforms incl. PC) | Rank | Publisher |
|---|---|---|
| Tom Clancy's The Division (PS4, XBO, PC)** | 1 | Ubisoft |
| Far Cry: Primal (PS4, XBO, PC)** | 2 | Ubisoft |
| The Legend of Zelda: Twilight Princess HD (NWU) | 3 | Nintendo |
| Grand Theft Auto V (PS4, XBO, 360, PS3, PC) | 4 | Take 2 Interactive (Corp) |
| UFC 2 (PS4, XBO)** | 5 | Electronic Arts |
| MLB 16: The Show (PS4, PS3)** | 6 | Sony (Corp) |
| Pokken Tournament (NWU) | 7 | Nintendo |
| NBA 2K16 (PS4, XBO, 360, PS3)** | 8 | Take 2 Interactive (Corp) |
| Call of Duty: Black Ops III (XBO, PS4, 360, PS3, PC)** | 9 | Activision Blizzard (Corp) |
| Minecraft (360, PS4, XBO, PS3) | 10 | Microsoft (Corp) |
Accessories
On a dollar basis, March 2016 video game accessory sales rose by 9 percent over March 2015, making March 2016 the highest-selling March on record for video game accessory sales.
Three types of accessories continue to propel overall accessory sales in 2016 (this trend continued in March): Video Game Cards, Gamepads, and Headsets/Headphones; all experienced double-digit growth in March 2016 vs. March 2015, and have sold $82MM more in Q1'16 versus Q1'15.
March 2016 marked the best March on record for Video Game Cards for both units and dollars, exceeding last March (the second-best March ever) by 20 percent in units and 16 percent in dollars.