May 2012 U.S. Video Games Industry Sales (NPD Group)
Following is analysis from The NPD Group's video game industry analyst, Anita Frazier
Overall
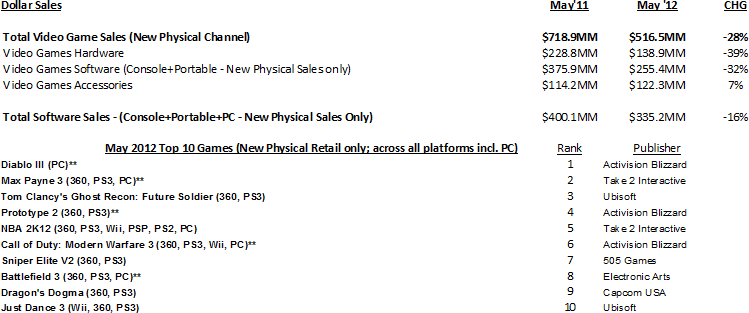
These sales figures represent new physical retail sales of hardware, software and accessories which account for roughly 50-60% of the total consumer spend on games. When you consider our preliminary estimate for other physical format sales such as used and rentals at $155MM, and our estimate for digital format sales including full game and add-on content downloads including microtransactions, subscriptions, mobile apps and the consumer spend on social network games at $420MM, we would estimate the total consumer spend in May to be $1.17B. Our final assessment of the consumer spend on these areas outside of new physical retail sales will be reported in September in our Q2 Games Market Dynamics: U.S. report.
NPD Group's U.S. Games Industry Sales (New Physical Sales Channel*) - May 2012
4-week month; Reporting Period 4/29/12 through 5/26/12

Hardware
All hardware platforms, save the 3DS, saw a decline in unit sales versus last year. The Nintendo DS, however, did realize a 35% lift over April 2012, catalyzed by the May 20th price reduction on the DSi and DSi XL. Even with the price drop on the DS platform, 3DS sales realized an increase of 17% over last May.
New Physical Software
PC Games sales realized a year over year increase of 230% realizing $80MM in sales, which softened the decline in software sales overall.
Diablo III is the top selling title for May, the first time since July 2010 that a PC-only game accomplished this feat. Since the game launched day and date through digital distribution as well, full sales of the title are some multiple of what is reflected in the retail sales. Starcraft II was the title that topped the best-seller list in July 2010, a testament to the power of the Blizzard brand in PC gaming.
To dig deeper into the new physical retail software performance this month, new launches generated 31% more dollars this May than they did last May, largely due to the success of Diablo III. This May, new SKU launches across console, portable and pc game software generated 188% more unit sales per SKU than they did last May. So while there were fewer new item introductions this May, they collectively generated more unit and dollar sales.
YTD 2012, there have been 27% fewer new software title introductions into retail which we believe is a big part of the softness we're seeing in May sales. A title obviously continues to see sales beyond its launch month, so there is a longer term impact from a narrower array of available new content. That said, we saw some exciting content at E3 that will come to market in the latter part of the year, and when great content comes to market, gamers are still showing up at the stores to buy it.
Accessories
The Accessory category continues to perform well due to increased video game card sales, up 74% from last May, as well as the continued success of Skylanders.