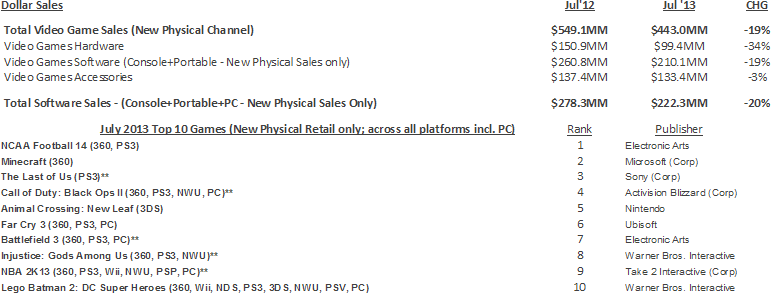
Video Games retail / e-tail sales in U.S. July 2013
These sales figures represent new physical retail sales of hardware, software and accessories, which account for roughly 50 percent of the total consumer spend on games. When taking into account our preliminary estimate for other physical format sales in July such as used and rentals at $134 million, and our estimate for digital format sales including full game and add-on content downloads including micro-transactions, subscriptions, mobile apps and the consumer spend on social network games at $593 million, the total consumer spend in July is just under $1.2 billion.
- NPDs final assessment of the consumer spend in these areas outside of new physical retail sales will be reported in November in its Q3 2013 Games Market Dynamics: U.S. report.
NPD Group's U.S. Games Industry Sales (New Physical Sales Channel*) - July 2013
4-week month; Reporting Period 7/7/13 through 8/3/13

Hardware
For the third consecutive month, hardware sales were led by the Nintendo 3DS. For consoles, the Xbox 360 had the highest hardware sales with July 2013, making it the leading console for thirty-one months in a row. The 3DS was the only hardware platform to show growth over last July.
The last time a portable was the top selling hardware platform for three consecutive months occurred from October 2010 to December 2010 with the Nintendo DS.
Software
July 2013 was another positive month for 3DS software sales, with strong double-digit growth in both units and dollars. Besides launches like Shin Megami Tensei IV, growth was driven by continued success from games that have launched over the past few months like Animal Crossing: New Leaf, and Luigi's Mansion: Dark Moon.
NCAA Football 14 was the top selling game this month, though sales were down slightly from last year's iteration.
After ranking third last month, Minecraft continued to sell well in July, ranking second on unit sales.
If the top software was ranked on an SKU basis, the following would have made the top 10 for July: 3DS SHIN MEGAMI TENSEI IV; 3DS LUIGI'S MANSION: DARK MOON; 360 GRAND THEFT AUTO IV: THE COMPLETE EDITION. It is unusual to see a software SKU that launched close to three years ago appear in the top 10, but clearly this is an indication that gamers who missed Grand Theft Auto IV are catching up before Grand Theft Auto V launches in September.
The Top 10 games represented a higher share of overall spending in July 2013 compared to July 2012. However, these ten titles combined to sell ten percent fewer units than the top ten last year.
Though there was only one game in the top 10 that was launched in July (NCAA Football 14), collectively, new launches from July 2013 were up compared to games launching in July 2012. As there was about the same number of software SKUs launched this year versus last year, we are seeing an increase of dollars and units generated per SKU from games launches this July compared to last.
Accessories
We continue to see strong growth in point and subscription cards compared to last year; this July represents the best July for point and subscription cards on record. This is partly driven by fewer games at retail throughout 2013, with gamers seeking content digitally. This becomes especially true during the summer where launch slates are lighter.