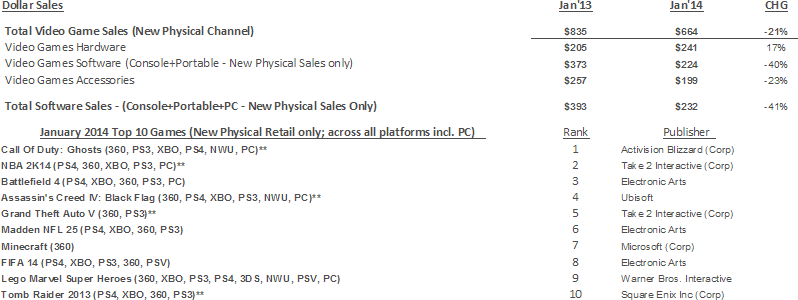
Video Games retail / e-tail sales in U.S. January 2014
As NPD and most retailers follow the National Retail Federation calendar, the January 2013 reporting period included the required "Leap Week" and was, therefore, a five week period. January 2014 was a 4-week month. When comparing January 2014 results to January 2013, an adjusted figure can be computed for trend purposes: multiplying January 2013 sales figures by 0.80 (four-fifths) will normalize the five-week period to a four-week level.
For more details regarding the "leap week" added to January 2013, see the link below: www.nrf.com/modules.php?name=Pages&sp_id=391
These sales figures represent new physical retail sales of hardware, software and accessories, which account for roughly 50 percent of the total consumer spend on games. When you consider our preliminary estimate for other physical format sales in January such as used and rentals at $113 million, and our estimate for digital format sales including full game and add-on content downloads including microtransactions, subscriptions, mobile apps and the consumer spend on social network games at $335 million, we would estimate the total consumer spend in January to be $1.05 billion. Our final assessment of the consumer spend in these areas outside of new physical retail sales will be reported in April in our Q1 Games Market Dynamics: U.S. report.
Overall retail video game sales (hardware, software, and accessories) would be down only 1 percent instead of down 21 percent, if sales were normalized to account for the 5-week January 2013 compared to the 4-week January 2014.
NPD Group's U.S. Games Industry Sales (New Physical Sales Channel*) - January 2014
4-week month; Reporting Period 01/05/14 through 02/01/14

Hardware
Continued success of the new consoles drove a 17 percent increase in hardware sales in January 2014, and when taking into account the 5-week month of January 2013 compared to the 4-week month of January 2014, normalized sales of hardware were up 47 percent.
PS4 led overall hardware sales this month, followed by the Xbox One.
Software
Based on looking at trends of a normalized January 2013 compared to January 2014, software dollar trends were down 25 percent.
A major factor in the decline in software this month was the slide in performance of November and December 2013 launches during January 2014 compared to how November and December 2012 launches performed in January 2013. These November and December launches collectively decreased 36 percent, or 20 percent when normalized to account for the 5-week January 2013.
There were about half the number of SKUs launched this January versus January 2013, leading to a 52 percent decrease in sales for new launches (or 39 percent when normalized for the 5-week January 2013). DMC: Devil May Cry and Ni No Kuni: Wrath of the White Witch were particularly strong launches in January 2013, causing a poor comparison for launches in January 2014.
3DS software sales and Wii U software sales increased when comparing to a normalized January 2013, up 6 percent and 26 percent, respectively.
Accessories
Accessories sales, when normalized to compare the 5-week January 2013 time period to the 4-week January 2014 time period decreased by 3 percent.
Interactive gaming toys and video game point and subscription cards helped to offset the declines in other accessory types, both with positive sales over a normalized January 2013.