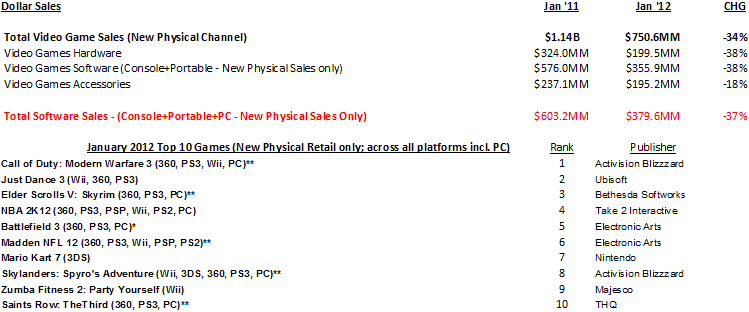
Jan'12 US Video Games Retail Sales (NPD Group)
Analysis from NPD analyst, Liam Callahan
Overall
"January retail performance experienced steep declines with a lack of software launches, and poor Hardware and Accessory performance partly related to bad comps from Kinect-related success in Jan'11."
"Outside of new physical retail sales, we estimate that the consumer spend on other ways to acquire content including used games, full game and add-on content downloads, social network games, mobile games, rentals and subscriptions accounted for an additional $350 - $400 million in sales. Our final quarterly estimate of the Q1 2012 consumer spend in these areas will be released in our Q1 Games Market Dynamics: U.S."
Hardware and Software
"Despite declines, the 360 was the top selling hardware platform for the 6th straight month."
"One factor for the double digit declines in New Physical Software was the lack of new launches. New Launches in January '11 represented 13% of dollar sales and new launch performance dropped 99% in Jan'12. Games like Dead Space 2, Little Big Planet 2, and DC Universe Online ranked within the top ten last year, making for a poor comparison in January '12 where there were no major releases."
"While the lack of new launches was a major reason for software declines, games which launched in Q4'11 also performed poorly in Jan'12, down 31% in units compared to Q4'10 launches in Jan'11. As shoppers were not drawn to stores due to new launch activity, this potentially impacted additional software purchases made on impulse."
Accessories
"Skylanders accessories continue to perform well at retail with the '1 character pack' SKU ranking highest on units for Jan'12. Collectively, Skylander accessories represented 22% of total accessory unit sales."
Sales results
NPD Group's U.S. Games Industry Sales (New Physical Sales Channel*) - January 2012
4- week month; January retail reporting period 1/1/12 through 1/28/12
