Video Games sales in U.S. (retail & digital) - December 2016
Total industry spend for December 2016 - that includes hardware, full game software (with digital full game data from participating publishers) and accessories - declined by 15 percent to $2.8B with declines in spending across all the categories.
2016 was a tough year for hardware spending. The category was down 24 percent as unit sales and the average retail price for consoles declined compared to 2015. On a positive note, Nintendo did shift an additional 4 percent of 3DS systems thanks in large part to the heightened demand for Pokemon.
NPD Group's U.S. Games Industry Sales - December 2016
5-week month ; Reporting Period 11/27/16 through 12/31/16
| Dollar Sales | 15-déc | 16-déc | Chg | 2015 | 2016 | Chg |
|---|---|---|---|---|---|---|
| Total Video Game Sales | $3.28B | $2.78B | -15% | $13.83B | $12.16B | -12% |
| Video Games Hardware | $1.24B | $994.9M | -20% | $4.86B | $3.68B | -24% |
| *Video Games Software (Console+Portable ; Physical and Full Game Digital Formats from the PSN, and Xbox Live platforms) | $1.35B | $1.19B | -12% | $6.16B | $5.79B | -6% |
| *PC Games Software (PC ; Physical and Full Game Digital Formats from the Steam platform) | $52.9M | $45.8M | -13% | $318.3M | $333.8M | 5% |
| **Video Games Accessories | $640.7M | $547.6M | -15% | $2.49B | $2.35B | -6% |
Video Games Hardware
The PlayStation 4 was the top-selling hardware system in the month and the PlayStation 4 Slim System 500GB Uncharted 4 : A Thief's End Bundle was the month's top seller.
Year-on-year there was a 10 percent increase in the number of Xbox One systems sold during December 2016.
Unit sales of 3DS hardware grew 2 percent in December versus year ago, the seventh straight month of year-on-year growth. The average price for 3DS hardware increased by 4 percent compared to December 2015, driving consumer spend growth by 6 percent. During 2016 Nintendo shifted an additional 4 percent in unit sales for 3DS, compared to the previous year, but declines in the ARP for the 2DS and the 3DS systems throughout the year resulted with dollar earnings declining by 7 percent.
Total hardware spending for 2016 reached $3.7B, a decline of 24 percent versus 2015. Unfortunately the release of the Xbox One S and the PlayStation 4 Pro did not generate dollar spending growth. Although the combined ARP for the Xbox One and PlayStation 4 systems decreased by 15 percent, consumers bought 7 percent fewer units.
The NES Classic Edition saw an increase in sales of 14 percent in December compared to its November launch.
Video Games Software
 Final Fantasy XV was the second best-selling title for December 2016, and was the top-selling title on the PS4. Final Fantasy XV experienced the best console launch month in the history of the franchise (since tracking began in 1995) selling 19 percent more new physical units than Final Fantasy XIII in its launch month and 54 percent more in total dollar revenue including digital full game sales.
Combined sales of Pokémon Sun and Moon are the best for the franchise since Pokémon Diamond and Pearl in 2007.
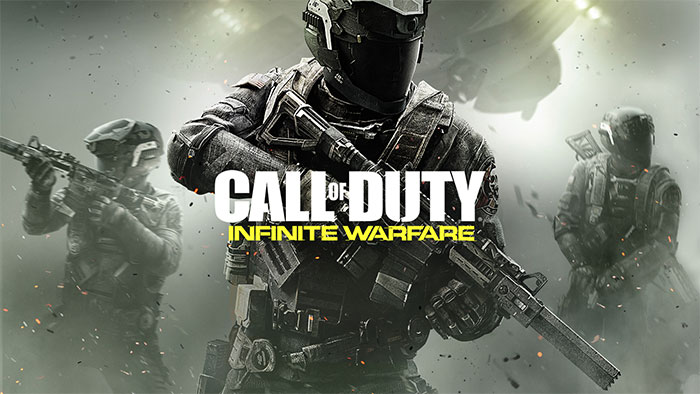
Although a Call of Duty has now topped the December sales chart for the ninth consecutive year, Final Fantasy XV was the best-selling game for the PS4 during the month.
It was a strong year for Battlefield 1, with dollar spending higher than last year's Star Wars Battlefront by 10 percent.
| December 2016 Top 10 Games ranked on dollar sales (1) | Rank | Publisher |
|---|---|---|
| Call of Duty : Infinite Warfare | 1 | Activision Blizzard (Corp) |
| Final Fantasy XV | 2 | Square Enix Inc (Corp) |
| Battlefield 1 | 3 | Electronic Arts |
| Madden NFL 17 | 4 | Electronic Arts |
| NBA 2K17 | 5 | Take 2 Interactive (Corp) |
| Watch Dogs 2 | 6 | Ubisoft |
| Grand Theft Auto V | 7 | Take 2 Interactive (Corp) |
| Pokemon : Sun*** | 8 | Nintendo |
| FIFA 17 | 9 | Electronic Arts |
| Pokemon : Moon*** | 10 | Nintendo |
Video Game Accessories
Total accessory spending (excluding gamecards) declined by 21 percent versus December 2015, driven by a 50 percent decline in Interactive Gaming Toys.
Gamecard spending in December 2016 increased 16 percent compared with prior December. Total spending on gamecards in 2016 was 7 percent higher than 2015.
The Interactive Gaming Toys segment consumer spend sold half the volume the segment achieved a year ago. The only brand to achieve year on year growth was Lego Dimensions, originally launched in September 2015.
Both the PlayStation 4 and the Xbox One gamepad spending increased in 2016 (when compared to 2015). However these increases were not enough to offset declines elsewhere as total gamepad spending declining by 5 percent during the year.