October 2018 Video Game spending in the U.S. shatters records
Analysis from NPD's VG industry analyst, Mat Piscatella
October 2018 tracked spending across video game Hardware, Software, Accessories and Game Cards grew 73 percent when compared to a year ago, to $1.5 billion. All categories of spend reflected growth, with sales of PC & Video Games Software more than doubling when compared to October 2017.
The $1.55 billion in October 2018 dollar sales represents the highest total spend for a month of October since The NPD Group began tracking the industry in 1995. The previous high was $1.36 billion reached in October 2008.
Year-to-date spending across video game Hardware, Software, Accessories and Game Cards has grown 21 percent when compared to the same period a year ago, to $10.5 billion. This is the highest year-to-date total spend achieved since the $10.9 billion achieved between January and October 2010.
NPD Group's U.S. Games Industry Sales - October 2018
4-Week Reporting Period : 10/7/2018 through 11/3/2018
| October 2018 Dollar Sales | Oct'17 | Oct'18 | CHG |
|---|---|---|---|
| Total Video Game Sales | $894m | $1.545 billion | 73% |
| Video Games Hardware | $238m | $300m | 26% |
| PC & Video Games Software [1] | $473m | $965m | 104% |
| Video Games Accessories & Game Cards | $182m | $280m | 54% |
| 2018 Year to Date Dollar Sales | 2017 YTD | 2018 YTD | CHG |
| Total Video Game Sales | $8.67 billion | $10.52 billion | 21% |
| Video Games Hardware | $2.29 billion | $2.72 billion | 19% |
| PC & Video Games Software [1] | $4.18 billion | $4.84 billion | 16% |
| Video Games Accessories & Game Cards | $2.19 billion | $2.96 billion | 35% |
Software
Dollar sales of Console, Portable and PC Games Software totaled $965 million in October 2018, more than doubling compared to a year ago. This represents an all-time high for PC & Video Games Software spending in an October month. The previous best of $743 million was reached in October 2008.
Year-to-date dollar sales of Console, Portable and PC Games Software reached $4.8 billion, up 16 percent versus a year ago. This is the highest year-to-date total for Software spending since the $5.3 billion achieved in the year-to-date 2011 comparable period.
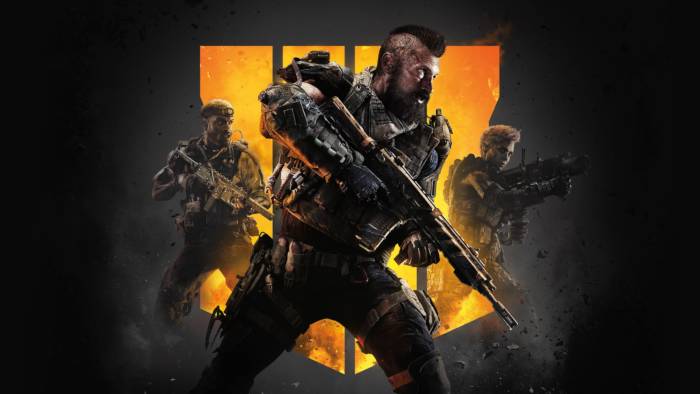
 Call of Duty : Black Ops IIII is the best-selling game of October. Call of Duty : Black Ops IIII launch month dollar sales represent the 8th highest in Video Game history since The NPD Group began tracking in 1995. Call of Duty : Black Ops IIII instantly becomes the best-selling game of the year, and the 2nd best-selling game across the past twelve month period, trailing only Call of Duty : WWII.
With just nine days of reported sales, Red Dead Redemption 2 is the second best-selling game of October 2018 and is now also the second best-selling game year to date. Red Dead Redemption 2 launch month sales more than tripled those of the previous title in the series, Red Dead Redemption, which launched May 2010.
Assassin's Creed : Odyssey repeated its September success, again ranking as the third best-selling game of the month.
Super Mario Party climbs the charts this month to rank fifth in October sales after its September debut placed it at number nine in the rankings. Over each title's first two months in market, Super Mario Party is now the third fastest selling Mario Party game in history, trailing only Mario Party and Mario Party 8.
Soul Calibur VI debuts as the sixth best-selling game of October. Soul Calibur VI achieved the third highest launch month dollar sales for the franchise in tracked history, trailing only Soul Calibur IV and Soul Calibur II.
Activision Blizzard was the highest revenue generating publisher for the month of October, while Take-Two Interactive has achieved the highest total revenue year to date.
October 2018 Top 20 Games (Physical and Full Game Digital for publishers in the Digital Leader Panel) ranked on dollar sales
| Title | Rank | Publisher |
|---|---|---|
| Call of Duty: Black Ops IIII^ | 1 | Activision Blizzard (Corp) |
| Red Dead Redemption II | 2 | Take 2 Interactive (Corp) |
| Assassin's Creed: Odyssey | 3 | Ubisoft |
| NBA 2K19 | 4 | Take 2 Interactive (Corp) |
| Super Mario Party* | 5 | Nintendo |
| Soul Calibur VI | 6 | Bandai Namco Games (Corp) |
| FIFA 19^ | 7 | Electronic Arts |
| Marvel's Spider-Man | 8 | Sony (Corp) |
| Madden NFL 19^ | 9 | Electronic Arts |
| WWE 2K19 | 10 | Take 2 Interactive (Corp) |
| Forza Horizon 4 | 11 | Microsoft (Corp) |
| Lego DC Super Villains | 12 | Warner Bros. Interactive |
| My Hero One's Justice | 13 | Bandai Namco Games (Corp) |
| Shadow Of The Tomb Raider | 14 | Square Enix Inc (Corp) |
| Mario Kart 8* | 15 | Nintendo |
| Grand Theft Auto V | 16 | Take 2 Interactive (Corp) |
| Super Mario Odyssey* | 17 | Nintendo |
| Diablo III*** | 18 | Activision Blizzard (Corp) |
| The Legend of Zelda: Breath of the Wild* | 19 | Nintendo |
| NHL 19 | 20 | Electronic Arts |
* Digital sales not included
^ PC digital sales not included
*** Diablo III sales include 100% of Physical and Digital on Sony and Microsoft consoles
Hardware
Hardware spending in October 2018 grew 26 percent when compared to a year ago, to $300 million. Significant gains in spending on both PlayStation 4 and Xbox One hardware were offset by declines across all other platforms.
For the 2018 year-to-date period, hardware spending has increased 19 percent, to $2.7 billion. Spending gains for Xbox One, PlayStation 4 and Plug N Play devices such as the NES Classic Edition and SNES Classic Edition continue to drive growth.
PlayStation 4 was October's best-selling hardware platform in both units and dollars sold. PlayStation 4 hardware unit sales achieved an all-time October high for the platform, while PlayStation 4 hardware dollar sales reached its highest point for an October month since October 2014.
October 2018 unit sales of PlayStation 4 reached the highest mark for any PlayStation hardware platform in an October month since the PlayStation 2 in October 2002.
Accessories & Game Cards
Total spending on Accessories and Game Cards grew 54 percent in October 2018 when compared to a year ago, to an all-time high of $280 million.
Year-to-date, Accessories and Game Card spending has grown 35 percent when compared to a year ago, to $3 billion. This is also an all-time high, besting the $2.2 billion generated in the 2017 year-to-date period.
Consumer spending on Headsets & Headphones doubled in October when compared to a year ago, while Gamepad spending increased 63 percent. Turtle Beach was October's leading manufacturer of Headsets & Headphones, while Sony ranked as the best-selling manufacturer of Gamepads.
Year to date, consumer spending on Headsets & Headphones has grown 87 percent when compared to a year ago, while Gamepad spending has grown 31 percent.