Video Games retail / e-tail sales in U.S. May 2015
In May 2015, overall sales across hardware, new physical software, and accessories declined by 13 percent. The 20 percent growth in accessories was unable to offset the 18 percent and 25 percent respective declines in new physical software and hardware.
NPD Group's U.S. Games Industry Sales (New Physical Sales Channel*) - May 2015
4-week month; Reporting Period 05/03/15 through 05/30/15
Dollar Sales | May'14 | May'15 | CHG |
Total Video Game Sales (New Physical Channel) | $584.9M | $507.6M | -13% |
Video Games Hardware | $186.4M | $153.6M | -18% |
Video Games Software (Console+Portable - New Physical Sales only) | $273.9M | $204.7M | -25% |
Video Games Accessories | $124.6M | $149.3M | 20% |
Total Software Sales - (Console+Portable+PC - New Physical Sales Only) | $283.8M | $212.3M | -25% |
Hardware
Hardware unit sales for eighth generation consoles were stable from May 2014, with the largest percentage and volumetric declines stemming from a drop in seventh generation consoles.
Year-to-date hardware unit sales are stable with a slight 1 percent decrease from the same time period last year. Eighth generation unit sales are stable, with seventh generation down 45 percent, and portable hardware sales up 41 percent.
Software
The decline in May 2015 is attributed to poor comparisons to a strong release slate in May 2014, specifically the launches of Mario Kart 8 and Watch Dogs. Collectively, May 2015 launches sold 55 percent less dollars than May 2014 launches, however, catalog games outside of the launch month sold 3 percent more dollar volume compared to catalog games in May 2014.
Despite poor comparisons to May 2014 releases, eighth generation consoles software unit sales rose 8 percent in May 2015, and also gained 15 percentage points in overall software unit share to total 54 percent.
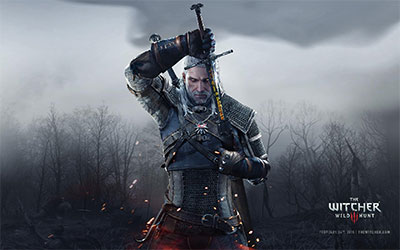
 The Witcher 3: Wild Hunt was the number one game this month and also had the best-selling first month unit sales within the role-playing super genre for eighth generation consoles.
With a consistent stream of launches through the first five month of 2015, Warner Bros. Interactive is the top software publisher year to date through May 2015, with over 140 percent increase in dollar sales versus last year. Warner is poised for further growth with the launch of highly-anticipated Batman: Arkham Knight, in June.
If the top 10 software list for May 2015 was ranked on a SKU basis rather than a title basis, PS4 Final Fantasy X/X-2 HD Remaster would make the list.
| May 2015 Top 10 Games (New Physical Retail only; across all platforms incl. PC) | Rank | Publisher |
| The Witcher 3: Wild Hunt (PS4, XBO, PC)** | 1 | Warner Bros. Interactive |
| Mortal Kombat X (PS4, XBO)** | 2 | Warner Bros. Interactive |
| Grand Theft Auto V (PS4, XBO, 360, PS3, PC) | 3 | Take 2 Interactive (Corp) |
| Minecraft (360, PS3, XBO, PS4) | 4 | Microsoft (Corp) / Sony (Corp) |
| Splatoon (NWU) | 5 | Nintendo |
| Call of Duty: Advanced Warfare (PS4, 360, XBO, PS3, PC)** | 6 | Activision Blizzard (Corp) |
| NBA 2K15 (360, PS4, XBO, PS3, PC) | 7 | Take 2 Interactive (Corp) |
| FIFA 15 (PS4, XBO, 360, PS3, Wii, 3DS, PSV)** | 8 | Electronic Arts |
| MLB 15: The Show (PS4, PS3)** | 9 | Sony (Corp) |
| Super Smash Bros. (3DS, NWU)** | 10 | Nintendo |
Accessories
May 2015 was a positive month for video game accessory sales, with dollar sales up 20 percent. The top 5 accessory types: Interactive Gaming Toys; point cards; gamepads; headsets/headphones; and power supplies, all experienced year-over-year growth.
Interactive gaming toy sales experienced stellar growth of 73 percent in May 2015 as Nintendo's amiibo accessories led dollar sales for the first time since launch.
May 2015 marked the best May ever for Video game points and subscription cards for both dollars and unit sales.